US nursing home data shows clearly that the COVID vaccines made things much worse
August 20 | Posted by mrossol | Health, Interesting, Mandates, Math/Statistics, Science, Transparency[non], VaccineSource: US nursing home data shows clearly that the COVID vaccines made things much worse
CMS publishes record-level nursing home data by week. When you analyze this data different ways, the conclusion is always the same: the vaccines were a disaster, increasing the death rate from COVID.
|
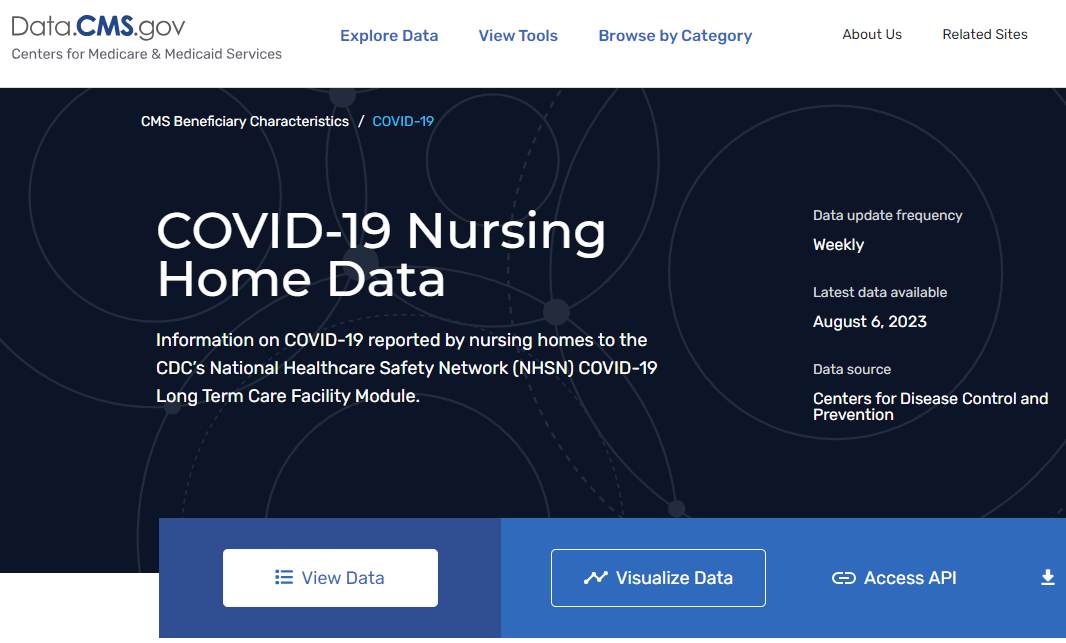 |
You can download the CMS nursing home data here by clicking the image. If this was a success story, you’d be reading about it in The New York Times. But the CDC and mainstream media are silent. That tells you everything you need to know. And if they try to publish a flawed analysis to try to gaslight you, it will backfire and be even worse for them.
Executive summary
We finally have the “gold standard” ground truth data that nobody can argue with showing that the COVID vaccines were a disaster for the elderly, the very population they were meant to protect.
The source of the data? Weekly infection, mortality reports from over 15,000 US nursing homes who were required to report their numbers to Medicare (aka CMS).
What makes this so important is that around 40% of the COVID deaths were in nursing homes. So nursing home COVID infection and death data is the “holy grail.” You cannot get any better than this.
So if this data is bad, it’s all over. There is no place to hide.
And the data is bad. Really bad. It would be hard to analyze this data and show it is a success.
CMS made a huge mistake by making the US Nursing home COVID data public where anyone who wanted to know the truth could analyze. Data transparency means that the truth is in plain sight. That’s really bad for the narrative.
So I did what any respectable “misinformation superspreader” would do… I downloaded the data and analyzed it.
I analyzed the data using 3 different methods (see my Excel spreadsheet) that I thought would be fair and objective and the results were consistent. If the vaccines really worked, the IFR in the months after the vaccine (after a waiting period) should have plummeted, but it went up by 20%.
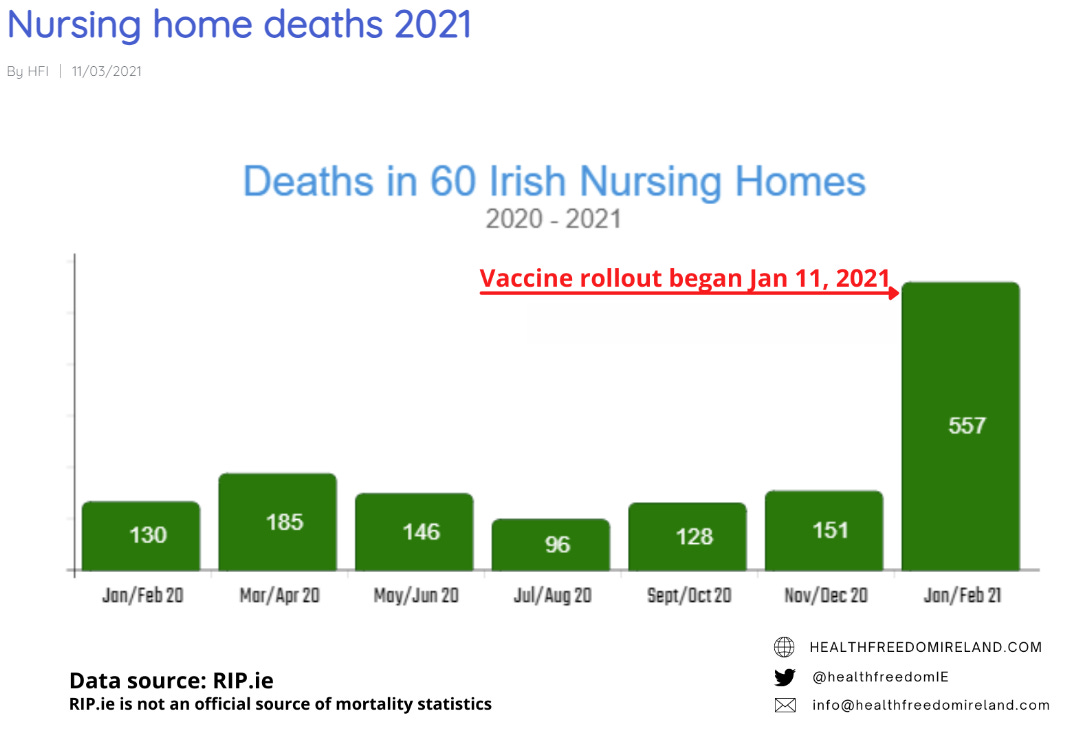
In addition, an analysis of elderly facilities in Ireland was fully consistent with what my analysis found: death rates in nursing homes skyrocketed right after the vaccines rolled out.
The CMS data shows that the vaccines were a disaster for the elderly 3 different ways:
- Short-term death rate of 25% or more: People died instantly or shortly after the shot was given. For example, at Annandale Care Center, MN, 8 people died on the day of the shot. The facility only has only 60 beds but at the time the facility was less than half full at 29 beds. So that is HUGE. That’s a same day death rate from the jab of 28% if everyone got the jab and it’s a higher rate if not everyone got the jab. This is crazy dangerous. But not all facilities get the same batch so that’s why the same-day kill rate can be very high at a single facility and lower at other facilities. Note: Annandale Healthcare Center was in the news and is a much larger facility, but is not the facility I just described, so be careful when fact checking this.
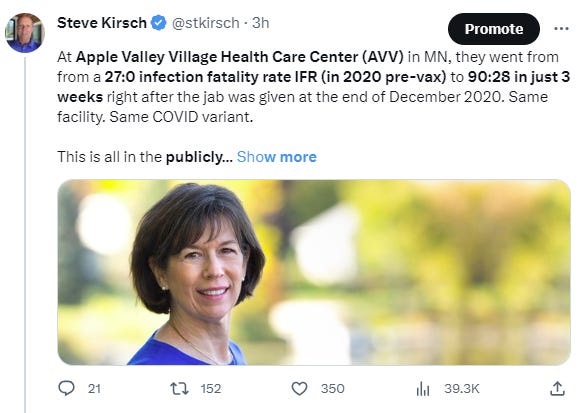
- Up to 2X higher likelihood of dying from COVID short term and an increased risk of catching COVID as well: Residents got a compromised immune system from the jab, so they got COVID and died from COVID in record numbers. For example, at Apple Valley Village Health Care Center (AVV) in MN, there were 90 COVID cases in the first 3 weeks of Jan 2021, and at least 28 people died as a result of those infections. Yet in all of 2020, there were just 27 COVID cases and not a single death from COVID. At AVV, they went from a 0:27 death:infection track record (pre-vax) to 28:90 in just 3 weeks right after the jab was given at the end of December 2020. Same facility. Same COVID variant. Why was the COVID infection-fatality rate (IFR) so drastically different with the same variant, the same facility, and the same resident population? I wanted to know the answer to that but everyone at AVV refused to return any of my calls. But we see this in other places. The only thing that makes any sense is that it was the vaccine because it checks all the boxes. No other hypothesis has been offered. The good news is the doubling of the COVID IFR appears to be temporary as the IFR was only 20% higher in the months after the shots were given.
- Up to 34% higher overall mortality risk for years post-jab: The jabs have permanently (or at least long term) weakened the immune system of all the recipients, young and old, so they are dying at a higher rate overall post-jab. On a small scale, you can see this in the Apple Valley deaths, for example (see the Apple Valley section below). On a larger scale, you can see this in all the excess deaths being reported such as BBC headlines the UK having their highest excess deaths in 50 years or in this article showing that kids 35-44 year olds are now dying at a rate 34% higher than before. That is a MASSIVE change. How can medical authorities be unable to explain the cause and fix it? Simple: they are not permitted to blame the vaccine so this will be a mystery forever. And they will never reveal the vaccination status of the kids who are dying because that would be a privacy violation. However, if you are unvaccinated and die, the news media is free to report that. Have you noticed that for all these sudden deaths and cardiac arrests, they never say “…and he was not vaccinated.”
The only good news was that the number of COVID infections dropped which means the COVID deaths dropped which resulted in a big drop in the all-cause mortality. Could this have been caused by the vaccine reducing the risk of infection? Yes, it’s possible. But we have excellent studies, such as the Cleveland Clinic study, showing the vaccine does the opposite: making you more likely to get COVID. And in nursing homes where we could validate the data from an insider, we learned that both the COVID rates and IFR dramatically increased right after the vaccine; this one facility cannot be explained away as a “fluke.” So the most likely hypothesis is that the virus simply burned itself out (and we see the ebb and flow of the COVID case rates over time where we actually got higher highs compared to the pre-vaccine period which is consistent with the studies (like the Cleveland Clinic study) that the vaccine made things worse).
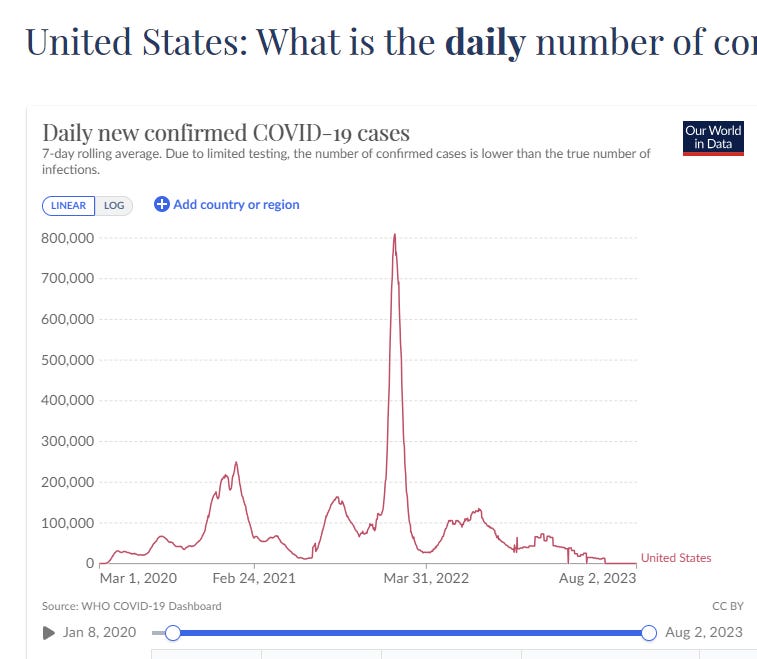 |
If the vaccine reduced risk of infection, subsequent peaks wouldn’t be 4X higher than peaks before the vaccine rollout.
The biggest surprise for me in viewing the data was the huge variation in the IFR even in the same month of the year between facilities, even those with high numbers of cases (where you would expect to see the most consistent numbers). This suggests that the vaccine batches are variable or there is something else going on. Some vaccine batches make you highly susceptible to getting COVID and/or dying shortly after the shot, and other batches are duds.
While batch variability is negatively impacting outcomes, it doesn’t seem like it works the other way, i.e., that any vaccine batches are actually improving outcomes. I only hear negative stories. When I ask for specific named facilities with a success story, I hear crickets.
Analysis methods
My Excel spreadsheet has two tabs with 3 different analyses:
- Overall odds ratio for dead:alive
- Year-to-date odds ratio change
- Before vs. after vax Odds ratio (OR)
- Change in the monthly values for IFR
They all showed the vaccine was a complete failure. In the period after the vaccine, you were simply more likely to die if you got COVID.
The analysis focused on showing that the vaccine made you more likely to die from COVID. Once you show that, it’s all over. All three analyses were consistent. They all showed that the IFR was around 20% higher after the jab. I calculated a p-value for analysis #3 and it was 3e-16, so it’s unlikely this happened by chance.
But the vaccine itself killed a large number of people as evidenced by the same day kill rate at places like Annandale where 8 people died on the same
The only good news was that the number of infections dropped which means the COVID deaths dropped which resulted in a drop in the all-cause mortality. But this was more likely due to the virus burning itself out via herd immunity for the current variant than anything that the vaccine could have done since the vaccine doesn’t provide infection or death protection; it does the opposite.
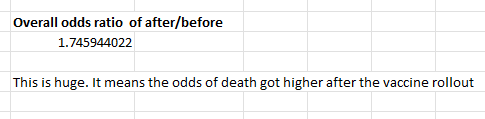
Overall odds ratio
This is on the IFR tab of the spreadsheet.
I simply compute the dead:alive for the period after the vax (Feb 2021 to May 2021) and divide it by the dead:alive for the period before the vax (Jun 2020 to the end of Jan 2021). I combined all the numbers from all 15,000 nursing homes with no omissions.
If the vaccine works, the ratio will be <1.
If the vaccine does nothing, the ratio will be 1 (assuming the same variant is in circulation which is true for the restricted time frame I used).
If the vaccine is making things worse and making you more likely to die, the ratio will be >1.
The ratio was 1.75 which is a disaster. That’s a huge red flag.
This is basically a showstopper and we don’t need to do anything else.
 |
From the IFR tab in the spreadsheet
Year-to-date odds ratios
If the data is corrupted then the aggregate numbers could be suspect. So I decided to give the vaccine the benefit of the doubt and compute things for each location separately.
This is non-conventional and will be a little weird to understand, but I wanted to see what % of nursing homes improved after the vaccine rollout vs. got worse.
I computed the dead:alive odds (died from COVID vs. infected by COVID) for two periods:
- From start of data in 6/1/20 until vax rollout on 1/3/21
- From start of data in 6/1/20 until 4/4/21
Then I took the ratio of 2 over 1 to compute an odds ratio.
This is super conservative that gives the vaccine the very best chance to work. This is because it’s more likely we’ll add infections rather than deaths. So odds computed in bullet #2 should nearly always be lower since you’ll be adding alive counts more often than dead counts.
I computed a single odds ratio on a per facility basis. If the number was >1, the facility got worse. If the number was <1, the facility improved.
If the vaccine worked as promised, every single facility should be showing a number <1. No such luck. Half the facilities got better, half got worse.
But what’s more important is comparing the facilities with the more extreme odds ratios. For example, if we had half the values at < .5 and the other half at between 1 and 2, then the vaccine is a success.
You can find the tests I did here:
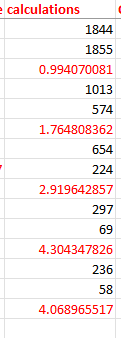 |
Column S in the Odds ratio tab
The short story is that far more facilities got worse than better, and the more extreme the deviation from 1, the greater the disparity.
The numbers in red are the odds ratio. So the point is that if a nursing home had a significant measurable change from “normal” after the vaccine rolled out, the odds were over 4:1 that the change would be strongly negative rather than positive.
In short, the vaccine once again is a disaster.
Before-after odds ratios
This is the same analysis as in the previous section, but the two time periods were non-overlapping, i.e., Odds in Q1 2021 / Odds in H2 2020
- From start of data in 6/1/20 until vax rollout on 1/3/21
- From 1/3/21 until 4/4/21 (this is the change so it’s non-overlapping)
I expected a much stronger signal here and that’s what I got.
The OR was 1.75 for any change from 1:
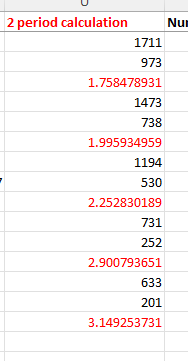 |
And it got worse from there so the stronger the deviation, the more likely it was to be negative, e.g., if the OR of a nursing home was >5, or < .2, it was 3.15 more likely to be an increasing chance of death.
In short, all things being equal, you were nearly twice as likely to find a facility that got worse than better. Again, a disaster for the vaccine: facilities were much more likely to get worse.
IFR analysis
For the IFR analysis, I went back to aggregating all the data. So instead of counting the number of facilities where the IFR got better or worse, I’m just adding up all the numbers of infections and all the deaths and computing the after/before odds ratio.
This is simple to understand. I computed the overall IFR on the period before the vax. I computed the overall IFR on the period after the vax. That’s it.
If the vax worked, the new IFR should be dramatically lower. Nope. The IFR increased. Are you surprised?
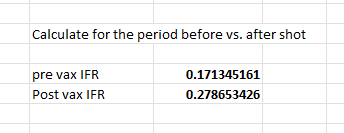 |
This means that if you get COVID right after you got the vaccine, you are 1.6 times more likely to die (compute from .278/.171)
I also checked for whether this difference was statistically significant using a Fisher Exact test on (cases minus deaths) vs deaths:
>>> analyze(511163, 90467, 21952, 6117, "IFR")

Statistics for IFR 511163 90467 21952 6117

One-sided p-value 9.978816028816743e-189

Odds ratio= 1.5744658622418792

ConfidenceInterval(low=1.52889659236017, high=1.621221062478143)
Again, this is highly statistically significant (p-value of 1e-188) and it appears that it’s very likely that the vaccine will increase your risk of death by 50% or more.
In short, it is making you 1.6X more likely to die, not less likely like they told you. That’s what the data says.
Ireland study confirms the same rise in mortality effect
In Ireland, different facilities were vaccinated at different times, and in every case, the deaths skyrocketed for 30 days after the vaccines were given, just like in the US. Here’s the aggregated data which is stunning: a 469% increase in deaths in the 2 months the jabs rolled out (and it’s like that for each nursing home individually which you will see if you click through to the study).
 |
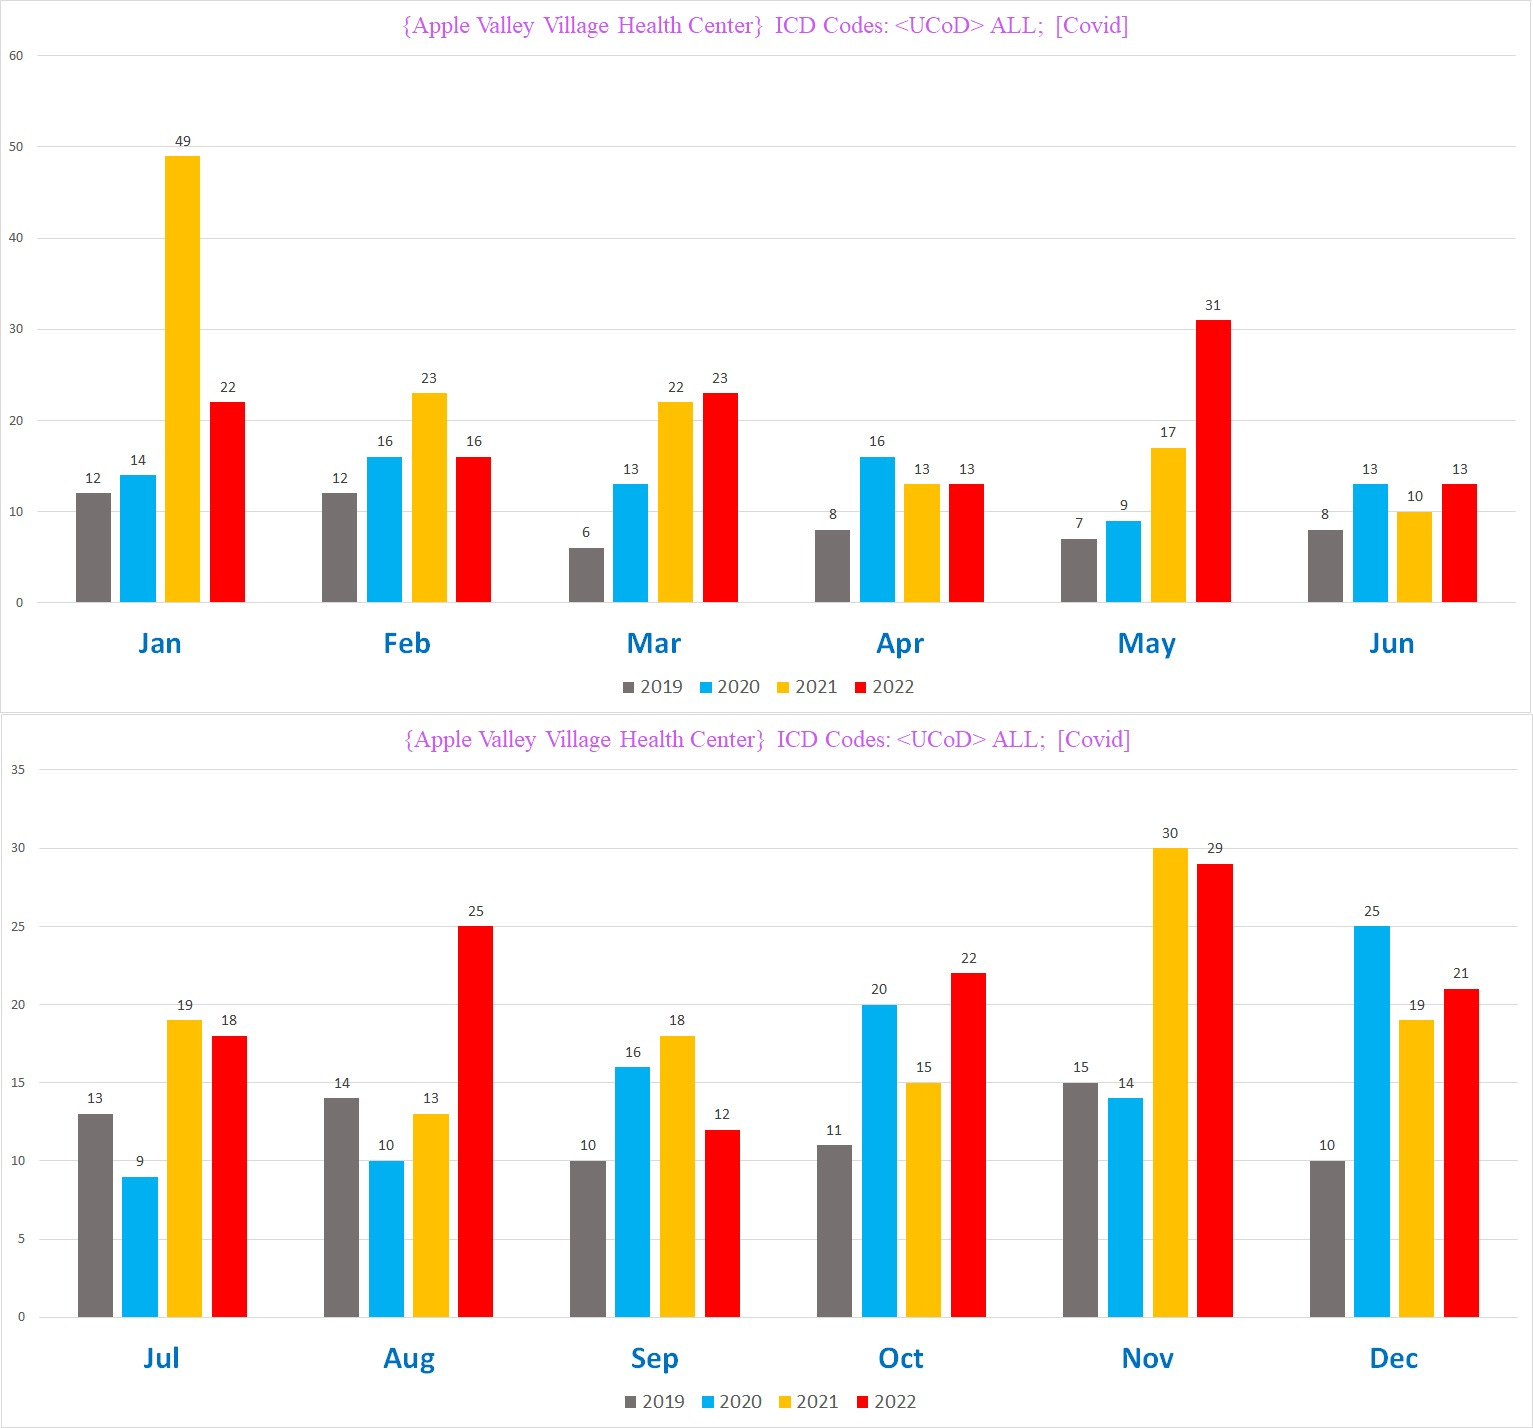
Apple Valley Village Health Care Center: An example
The vaccine can cause mortality among the vaccinated to be high for years. We saw this in the VAERS data where for all other vaccines, deaths are clustered near the time of injection. But for the COVID vaccines, peaks continue out for years.
You can see this effect very clearly from the “gold standard” Medicare data (pulled from HHS) where both peaks and valleys are higher than before. The high peak was 50 deaths and it happened in Jan 2021, right after the jabs rolled out. That was an all-time high for that facility.
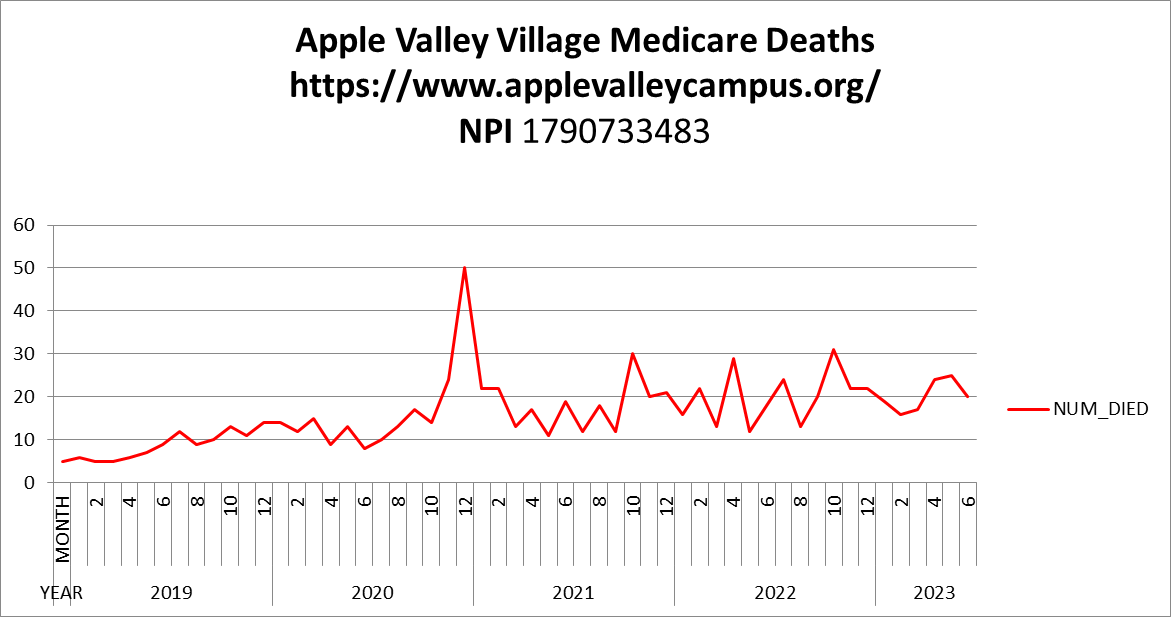 |
This is gold standard evidence from the Medicare database that is kept hidden from public view. See the higher highs and higher lows after the vaccine rollout? The peak is at 50 in January 2021, right after they rolled out the vaccine. They have never had that many deaths in a month before. If the vaccine didn’t cause it, what did? I tried to ask, but nobody would return my phone call. I guess that’s just the way it goes.
The average monthly all-cause mortality death count at AVV:
- 2019: 8.2
- 2020: 13.6
- 2021: 20.5
- 2022: 20.1
- 2023: 20.4
As you can clearly see the troubling news: the deaths per month did not reset back to the baseline rate. Here are the all-cause mortality counts since 2019:
 |
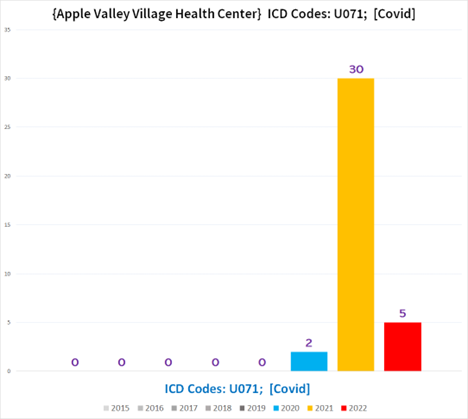
COVID deaths are even more stunning. Nearly all the deaths happened within a period of 3 weeks after the COVID vaccine was given. This chart would be more spectacular if the x-axis were in months instead of years. You would see this giant bar right after the vaccine was given. That’s too big to dismiss as “an anecdote” and we know from an insider that there was panic in the facility after they rolled out the shots due to all the deaths.
 |
Criminal charges
Finally, criminal charges should be filed against AVV and other nursing home facilities where they gave the second jab of the primary series after realizing the first jab was killing people. The staff at the nursing home has a duty of care and it was obvious to the staff at AVV that people were dying in droves after the first shot. To their credit, no staff or resident was required to get the shot.
Yet, even after they knew the jab was deadly, they offered the second shot of the primary series to residents.
This is criminal negligence and people need to go to jail so this doesn’t keep happening.
The PREP act protects against civil liability only. This behavior is criminal. These people are not protected and need to be charged.
I plan on filing a complaint to the proper authorities shortly.
All it will take is one criminal conviction and it will change everything. Any federal, state, or local government attorney can bring these charges. “I was just following orders” doesn’t exonerate these people of liability and neither does the PREP act.
Of course, Congress could simply write a law exempting everyone from criminal liability too. After all, it does seem like the goal is to protect the vaccine, not the public.
This is a big deal: 40% of the COVID deaths are in nursing homes.
The CMS Nursing home dataset I used here is very important because a huge fraction of COVID deaths were in nursing homes at the time of the vaccine rollout:
 |
Where is their analysis?
If the CMS Nursing home data proves the vaccines actually reduced COVID IFR where is their analysis of that? I found no evidence of this and looked at this data many different ways including very unconventional ways.
If the vaccine didn’t kill people, how do they explain the 28% death rate at Annandale on the same day as the shot?
If I’m wrong, why isn’t anyone supporting the narrative publishing their analysis and getting the mainstream medical community to align behind it. I’d like that because it will then create an easy target for us to bring the whole house of cards down by discrediting their analysis.
For more information
Death Certificates Confirm that Apple Valley Village Health Center Experienced a Mass Dying Event in January 2021 – TrialSiteNews
They got the death certificates and confirmed the numbers matched up. The graphs are stunning.
Death Certificates Confirm that Apple Valley Village Health Center Experienced a Mass Dying Event in January 2021
Ashmedai substack which obtained death certificates to match up with the data I found.
Ireland nursing home data
Same thing happened in Ireland: an instant 468% increase in the 2 month period where the jabs were rolled out. This is impossible to explain if it wasn’t the jabs.
Twitter thread on Apple Valley (Ashmedai)
Lots of charts.
My Twitter post
 |
Summary
This CMS data is ground truth data. It simply doesn’t get any better than this dataset: it’s the biggest target audience, the data is fully reported on a per facility basis, and there are over 1M data reports and the data is provided on a record level basis. The data isn’t perfect, it never is, but this data is really “the very best you can get.” You cannot do any better. This is the best.
And this is also the very “best case” analysis where the vaccine should perform at optimum levels and the COVID IFR should have dropped like a rock. Here’s why: in early 2021, the US was still on the original variant so the vaccine matched the variant. Instead of the IFR dropping like they promised, the IFR dramatically increased. The vaccine was a complete bust. It did the opposite. Not only could you die from the shot itself, but it made it more likely you’d get COVID, and more likely for you to die from COVID. In short, it made everything worse.
There wasn’t a single thing that the COVID vaccine did that improved health outcomes.
There also appears to be a huge QA problem with the batches. Some facilities had an “impossibly high” instant or near instant death rate while other places reported no problem. You can’t have a 25% same-day death rate at one facility and a 0% same-day death rate at another facility if there isn’t a QA problem with batches.
The nursing facilities that saw the huge death rates after dose #1 should never have offered any of their residents Dose #2. They should be held criminally liable for ignoring their duty to protect their residents.
Will this analysis change anyone’s behavior? No, they will just ignore it as they always do because they cannot respond to it. It would just draw public attention to all the harm they’ve caused.
But I thought you should know the truth.
You’re currently a free subscriber to Steve Kirsch’s newsletter. For the full experience, upgrade your subscription.


Leave a Reply
You must be logged in to post a comment.