VAERS Data Shows That Vaccines Cause Autism
July 24 | Posted by mrossol | Health, Science, VaccineI admit that my inquisitiveness has been pulled into this question of vaccines, autism, other impacts of vaccines for “no apparent reasons”, except maybe our experience with mRNA and concern for my own grandchildren. Their parents are responsible for decision around vaccination, as I was of our four children. I pray God would protect them irrespective of parental decisions. mrossol
Source: VAERS data shows that vaccines cause autism
Executive summary
I did a VAERS query over all time and all vaccines to look at the total autism counts.
If autism is not related to vaccines, the counts should be proportional to doses administered for that vaccine in childhood when kids are most susceptible.
What I found is that the number of reports is vaccine-type dependent.
This is IMPOSSIBLE to explain if vaccines don’t cause autism.
But if I’m wrong, perhaps someone will enlighten me in the comments as to how I got it wrong!
The CDC childhood vaccine schedule
Here’s what the CDC childhood vaccine schedule looks like today:
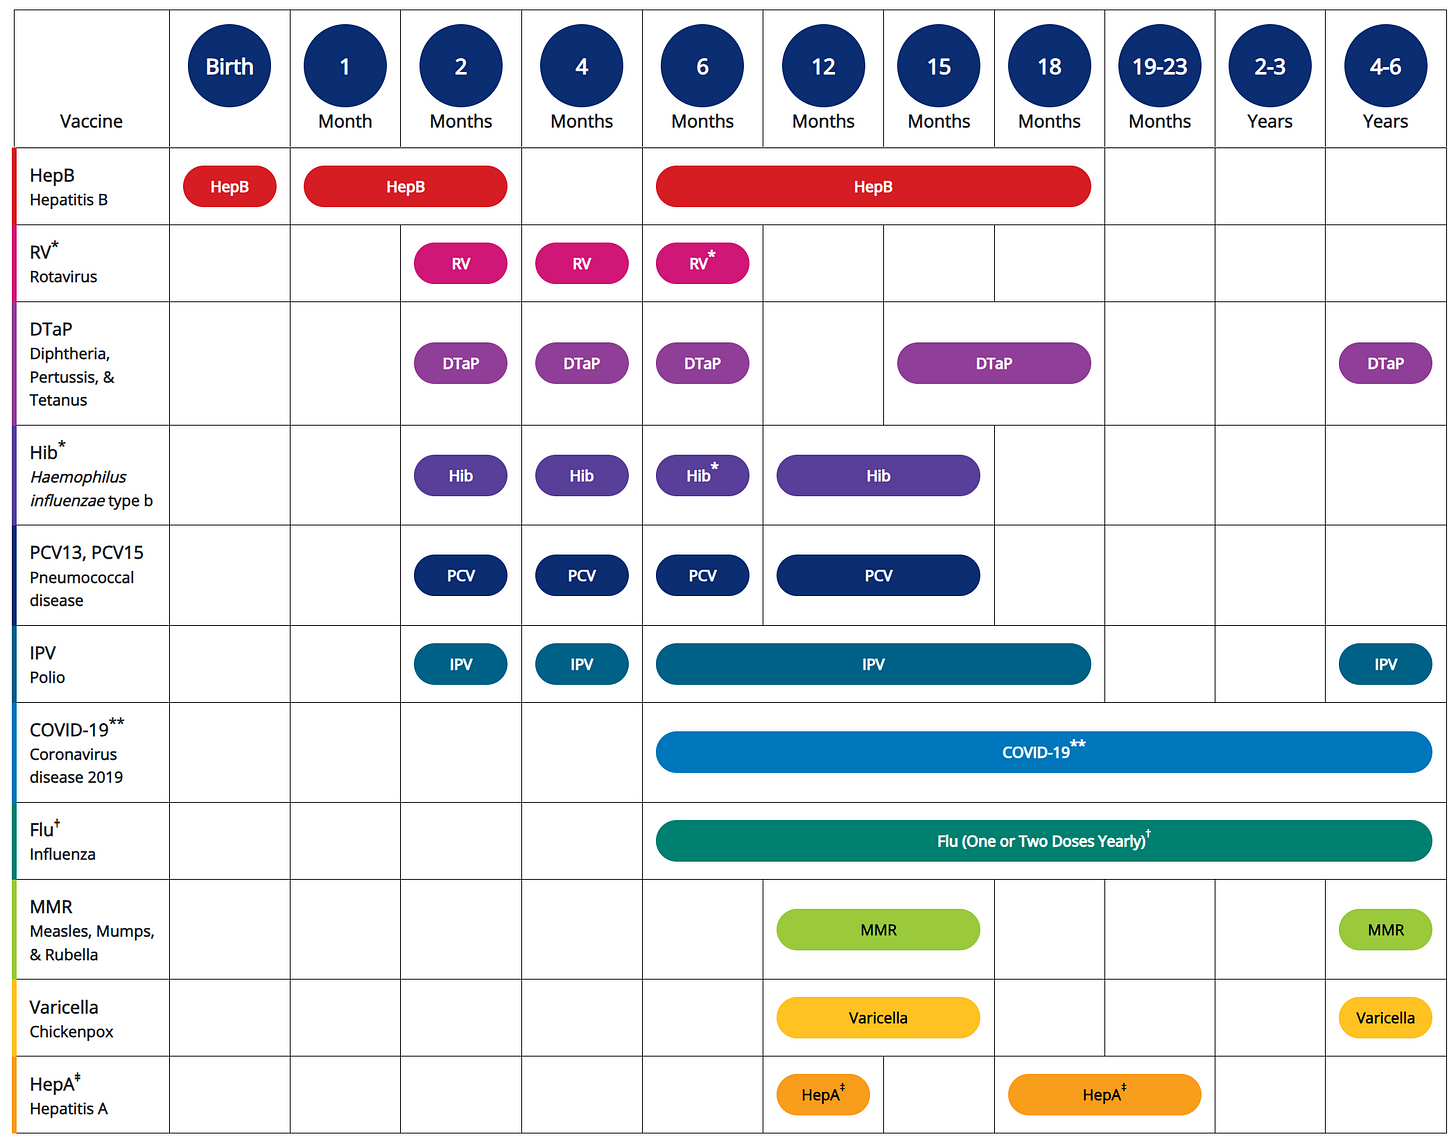
Here were the significant changes in recent years:
- In 2011, the CDC introduced the 16th vaccine, the Haemophilus influenzae type b (Hib) vaccine, as part of the routine childhood immunization schedule.
- In 2014, the CDC updated the schedule to recommend that the first dose of the measles, mumps, and rubella (MMR) vaccine be administered at 12-15 months of age, instead of the previous recommendation of 12-18 months.
- In 2016, the CDC introduced a two-dose regimen for the human papillomavirus (HPV) vaccine, which was previously administered as a three-dose series.
- In 2017, the CDC updated the schedule to include a preference for the use of the recombinant zoster vaccine (Shingrix) over the live zoster vaccine (Zostavax) for the prevention of shingles.
- In 2020, the CDC introduced the routine use of the MenB vaccine, which protects against meningococcal serogroup B bacteria, for certain populations at increased risk.
What we should expect to see
We should expect to see comparable numbers on vaccines on the CDC childhood schedule.
VAERS query results
I limited the queries to US only, segmented the age at vaccination, and only looked at 2011 onwards.
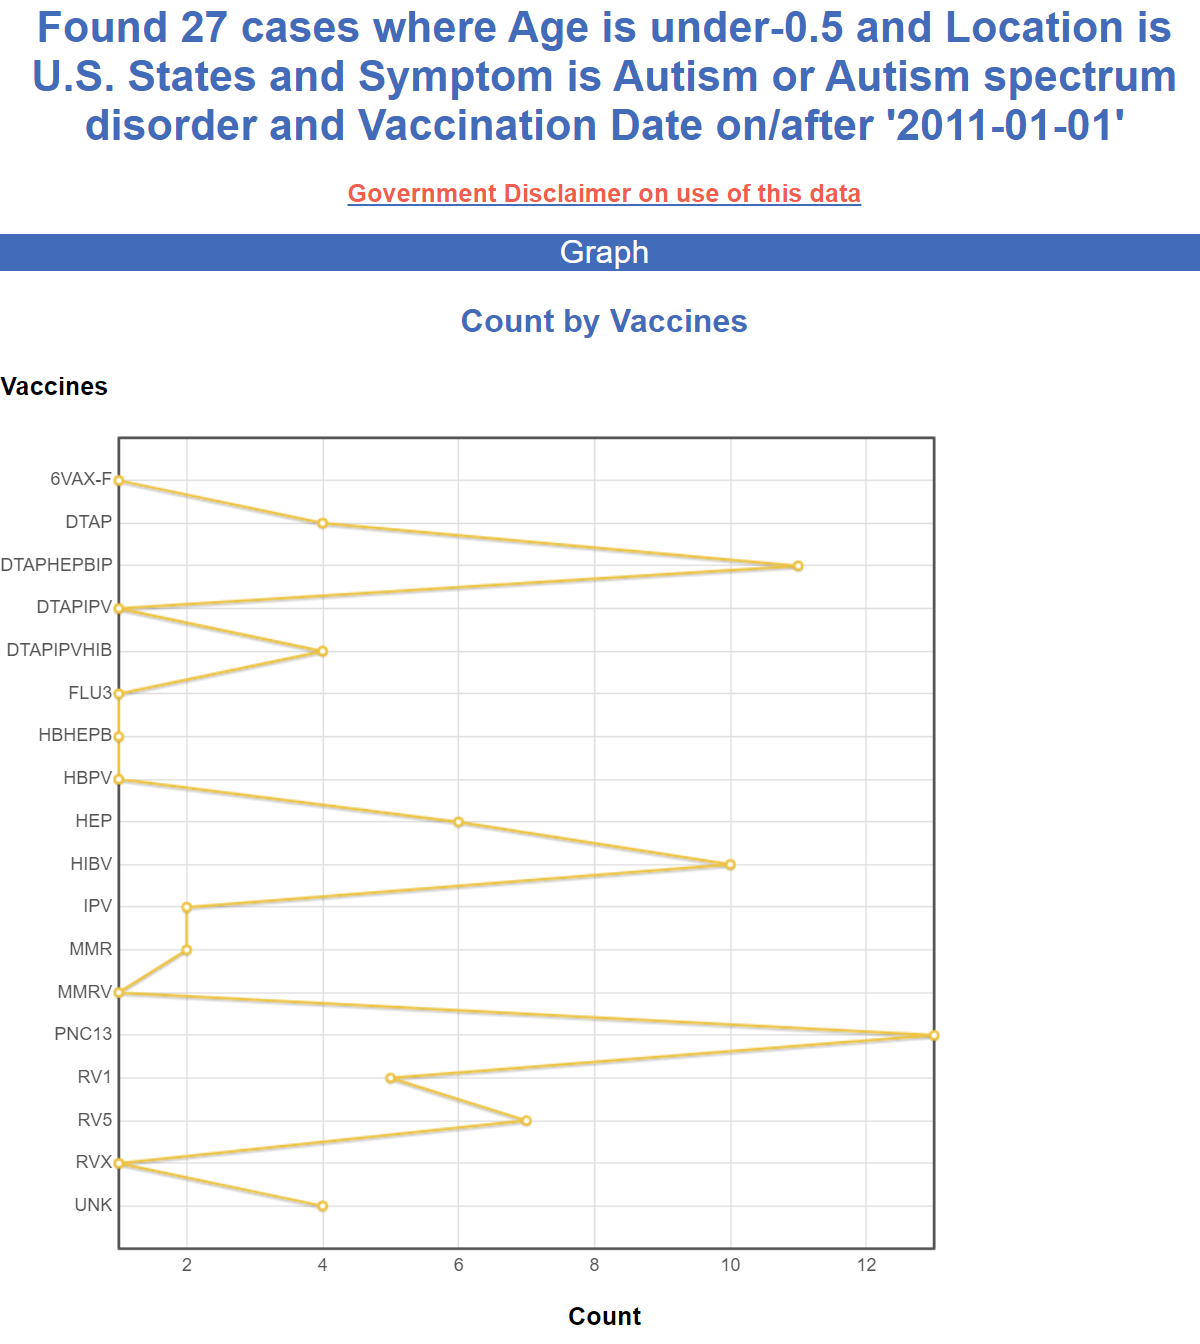
Under 6 months
A child gets the same number of:
- Hep B
- Rotavirus
- DTaP
- Hib
- PCV
- IPV
shots.
So we’d expect the same number of reports. We get:
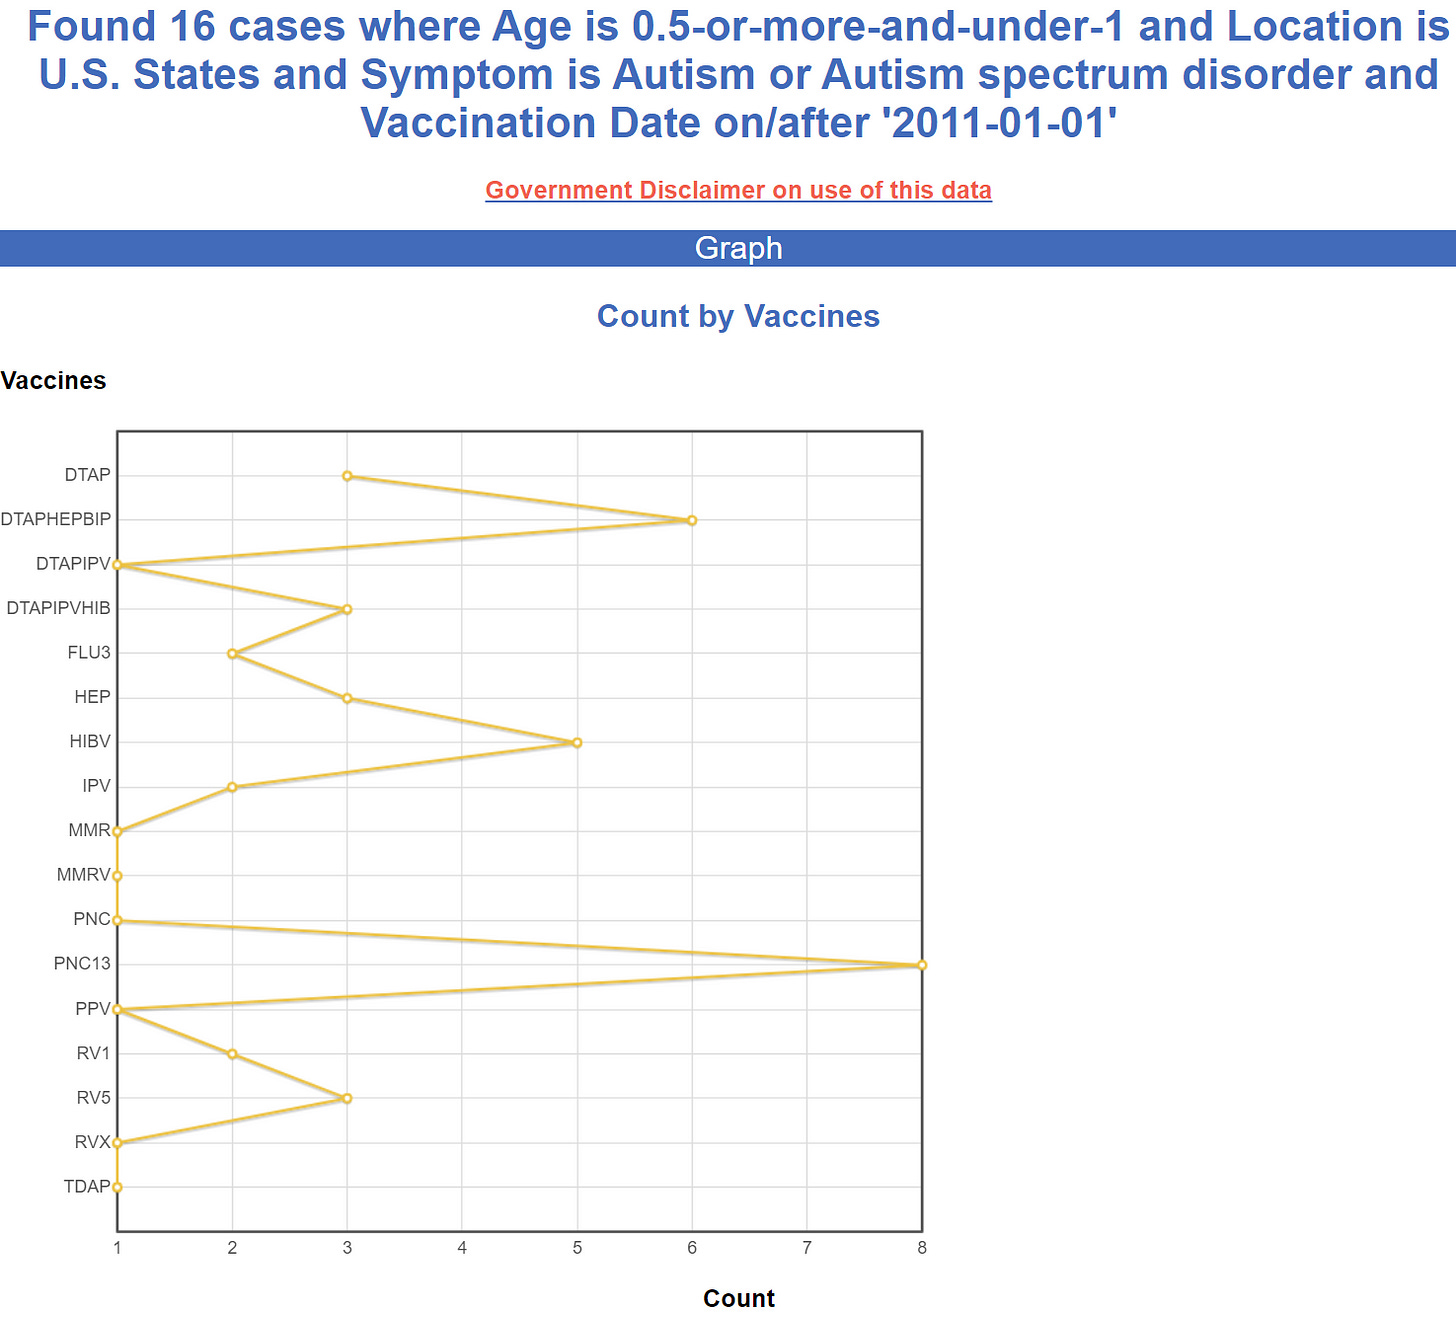
- Hep B: 11+1+6=18
- Rotavirus: 5+7+1=13
- DTaP: 4+11+1+4=20
- Hib: 1+1+10=12
- PCV: 13
- IPV: 11+1+4+2=18
which could be the same statistically since the numbers are so small. The bundling of the vaccines makes this hard. Looks suspicious, but not a statistically significant difference.
6 months to 1 year
1 to 1.5 years old
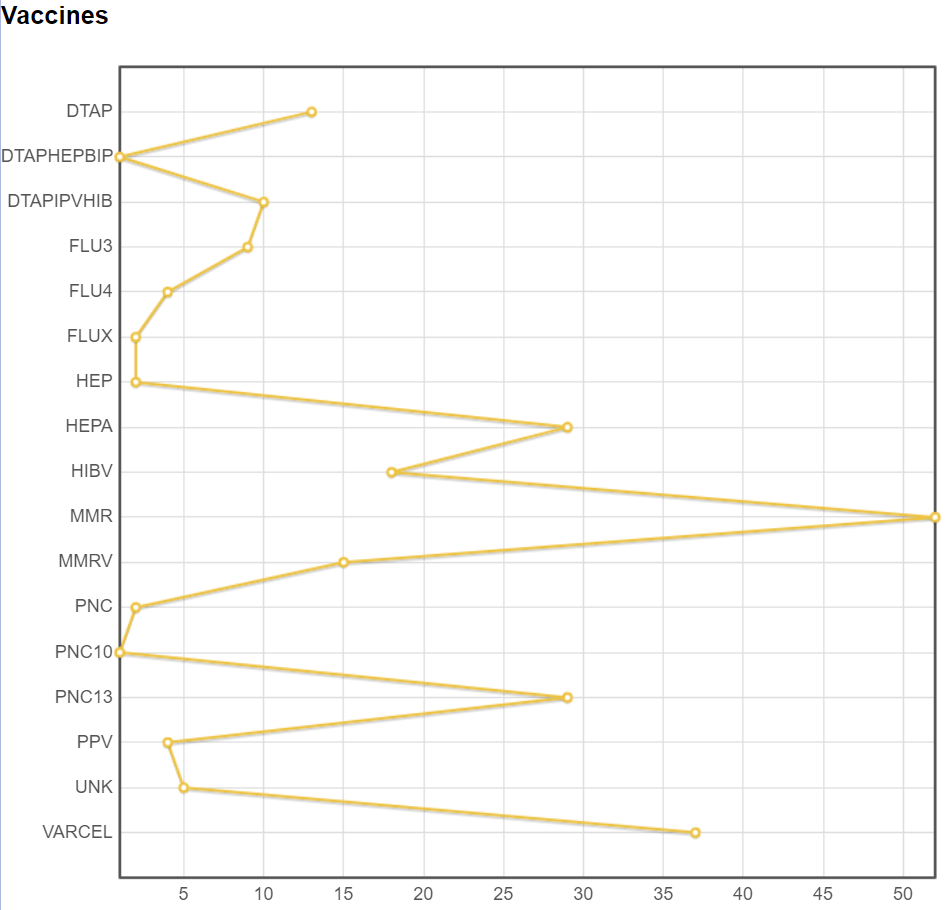
Vaccines and their counts are:
- Hep B: 1+2=3
- DTaP: 13+1+10=24
- Hib=1+10+18=29
- PCV=2+1+29+4=36
- IPV=1+10=11
- MMR=52+15=67
- Varicella: 37+15=52
- Hep A: 29
- Flu: 9+4+2=15
The Hep B vax has only 3 cases, but part of the reason is that HepB is distributed over a wider range (down to six months). If we add in the 9 cases from 6 months to 1 year, we get 12 cases.
The leader is MMR with 67. In close second is the varicella vax at 52. The varicella alone is 37. That will be most conservative as a comparator.
If we compare 12 with 37, the p-value is 0.0005. So this difference was unlikely to happen just because the numbers are small. This is hard for anyone to explain.
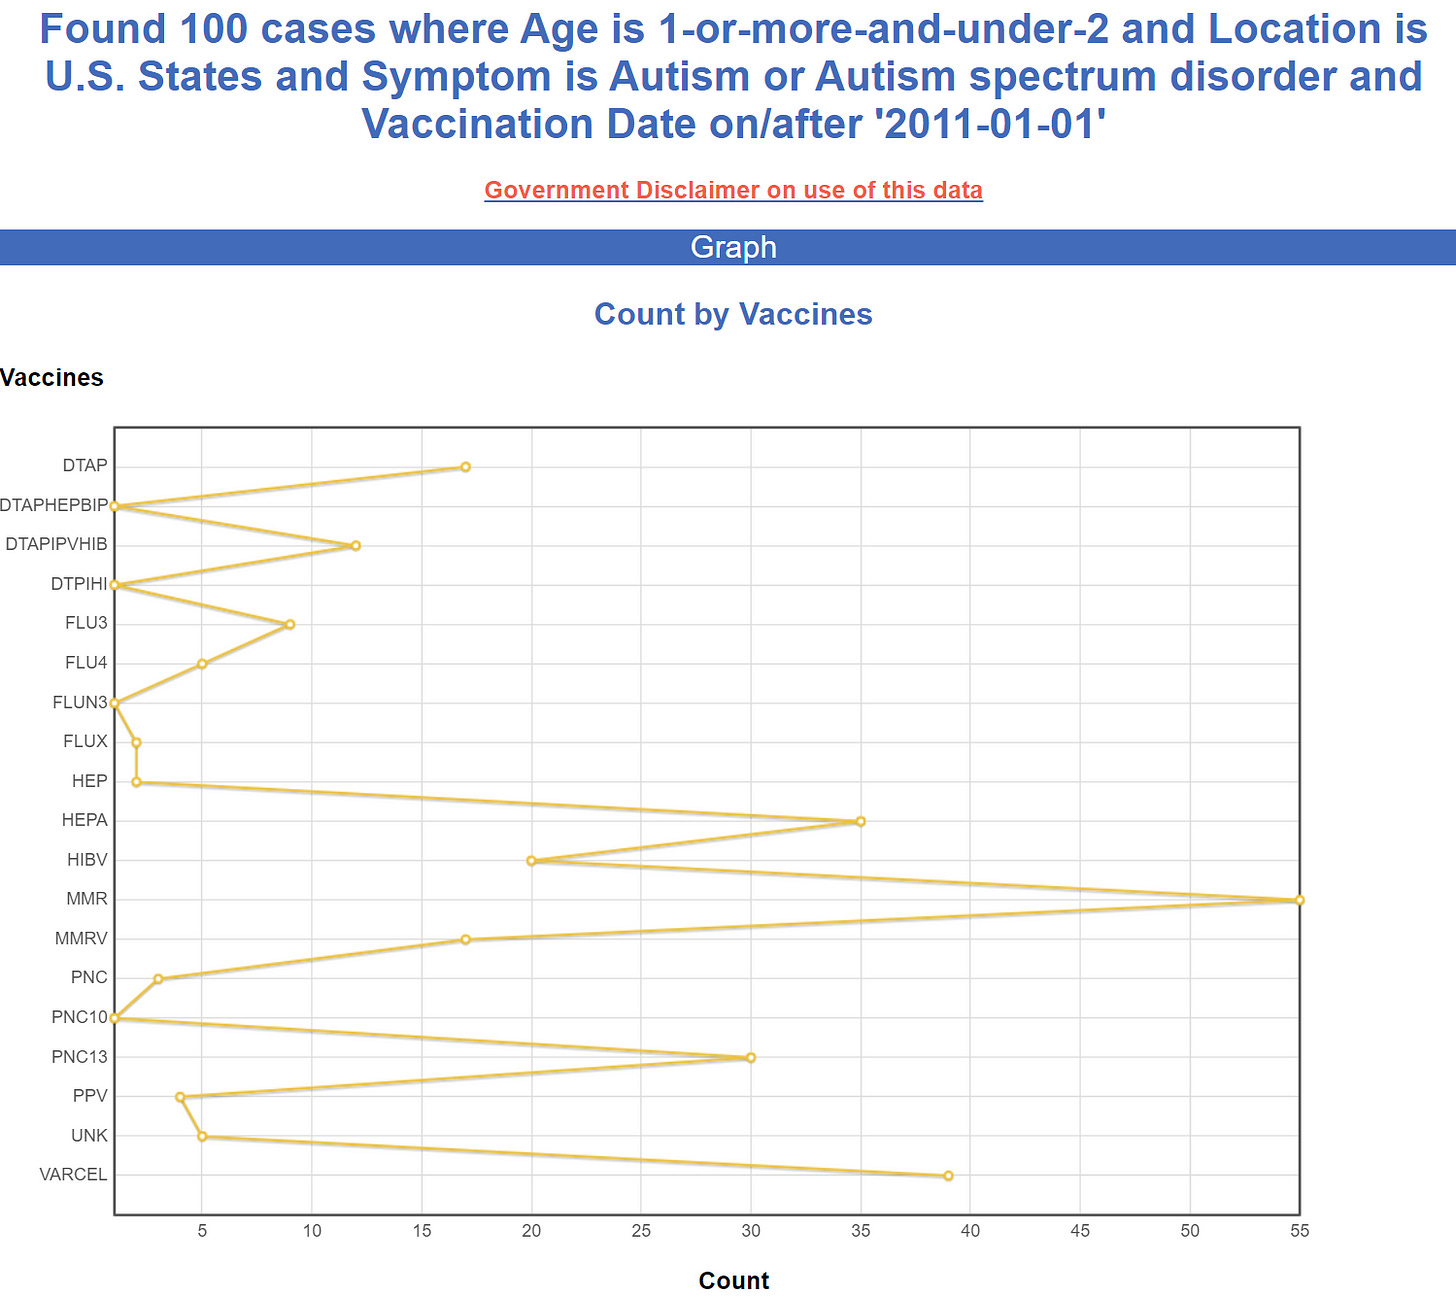
1 to 2 years old
Not much different than the previous graph. Again, Hep B is low and the MMR and varicella vaccines are high.
2 to 3
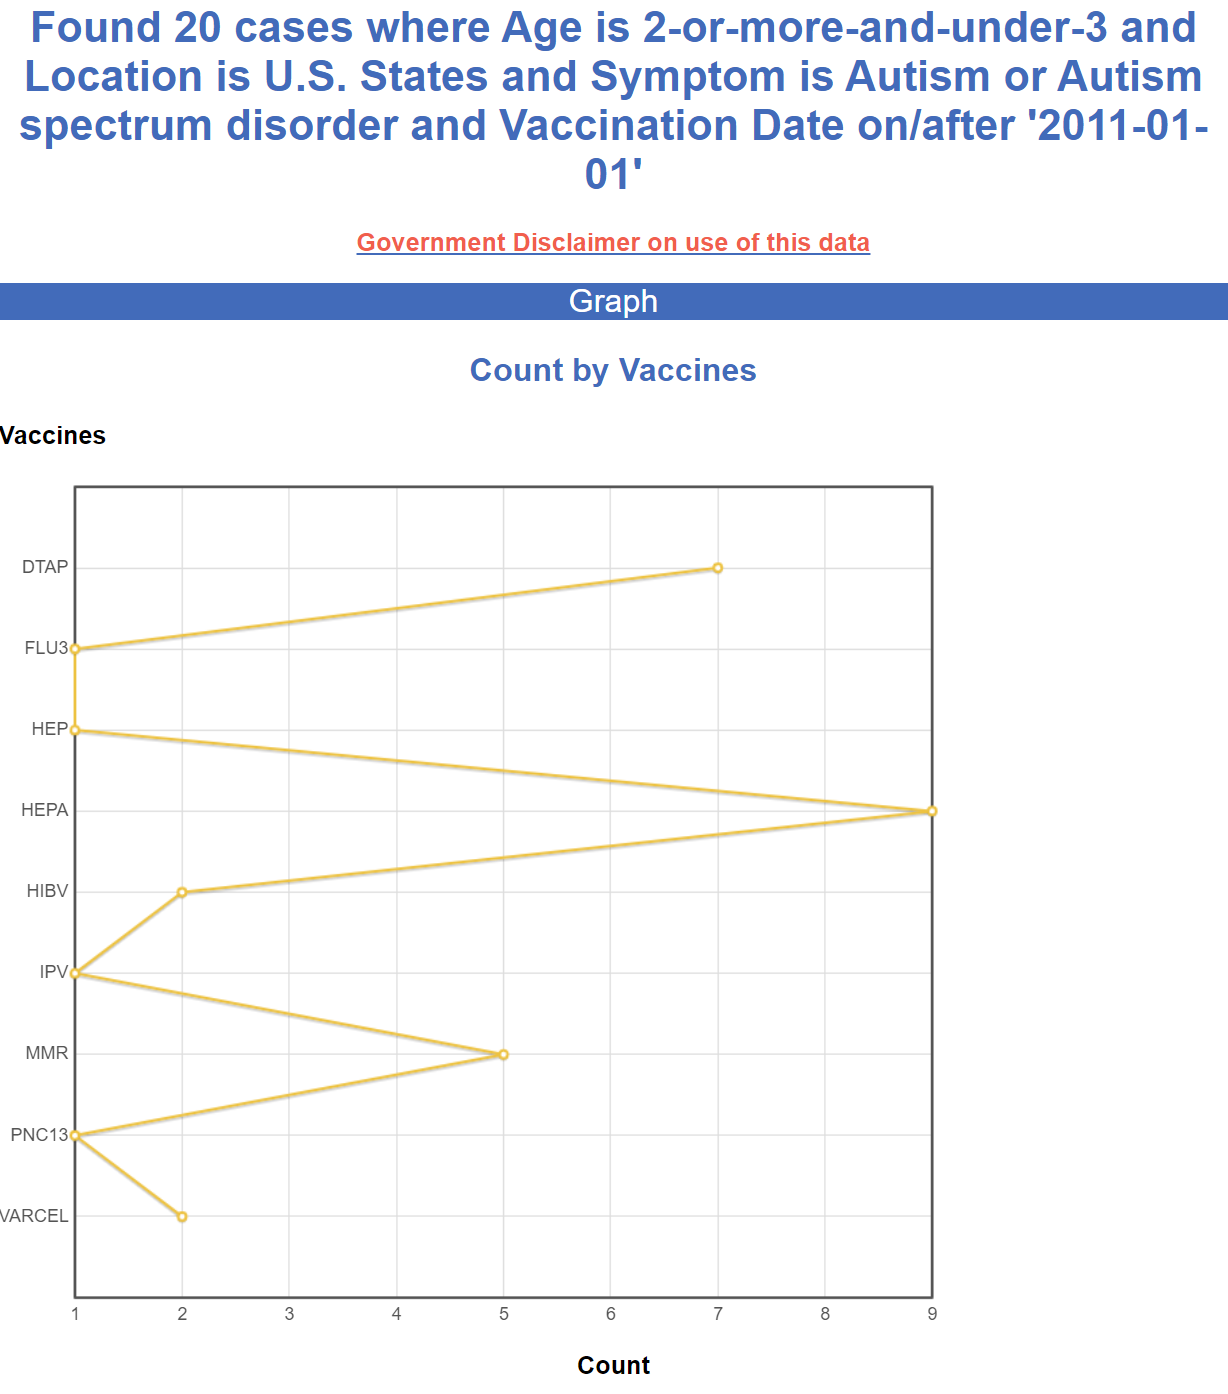
No shots are recommended in this age range, so we should see residual autism from shots given earlier.
Hep A makes sense since these are likely from “late” shots that should have been given in the earlier period.
But the deadline for giving DTaP and Hep B are exactly the same. So we should get comparable counts of both. However, Hep B has a longer time window, so one could argue the rates are lower there due to fewer shots.
4 to 6
Between 4 and 6 years old, one dose of the following vaccines are on the schedule:
- DTaP
- IPV (Polio)
- COVID
- Flu
- MMR
- Varicella
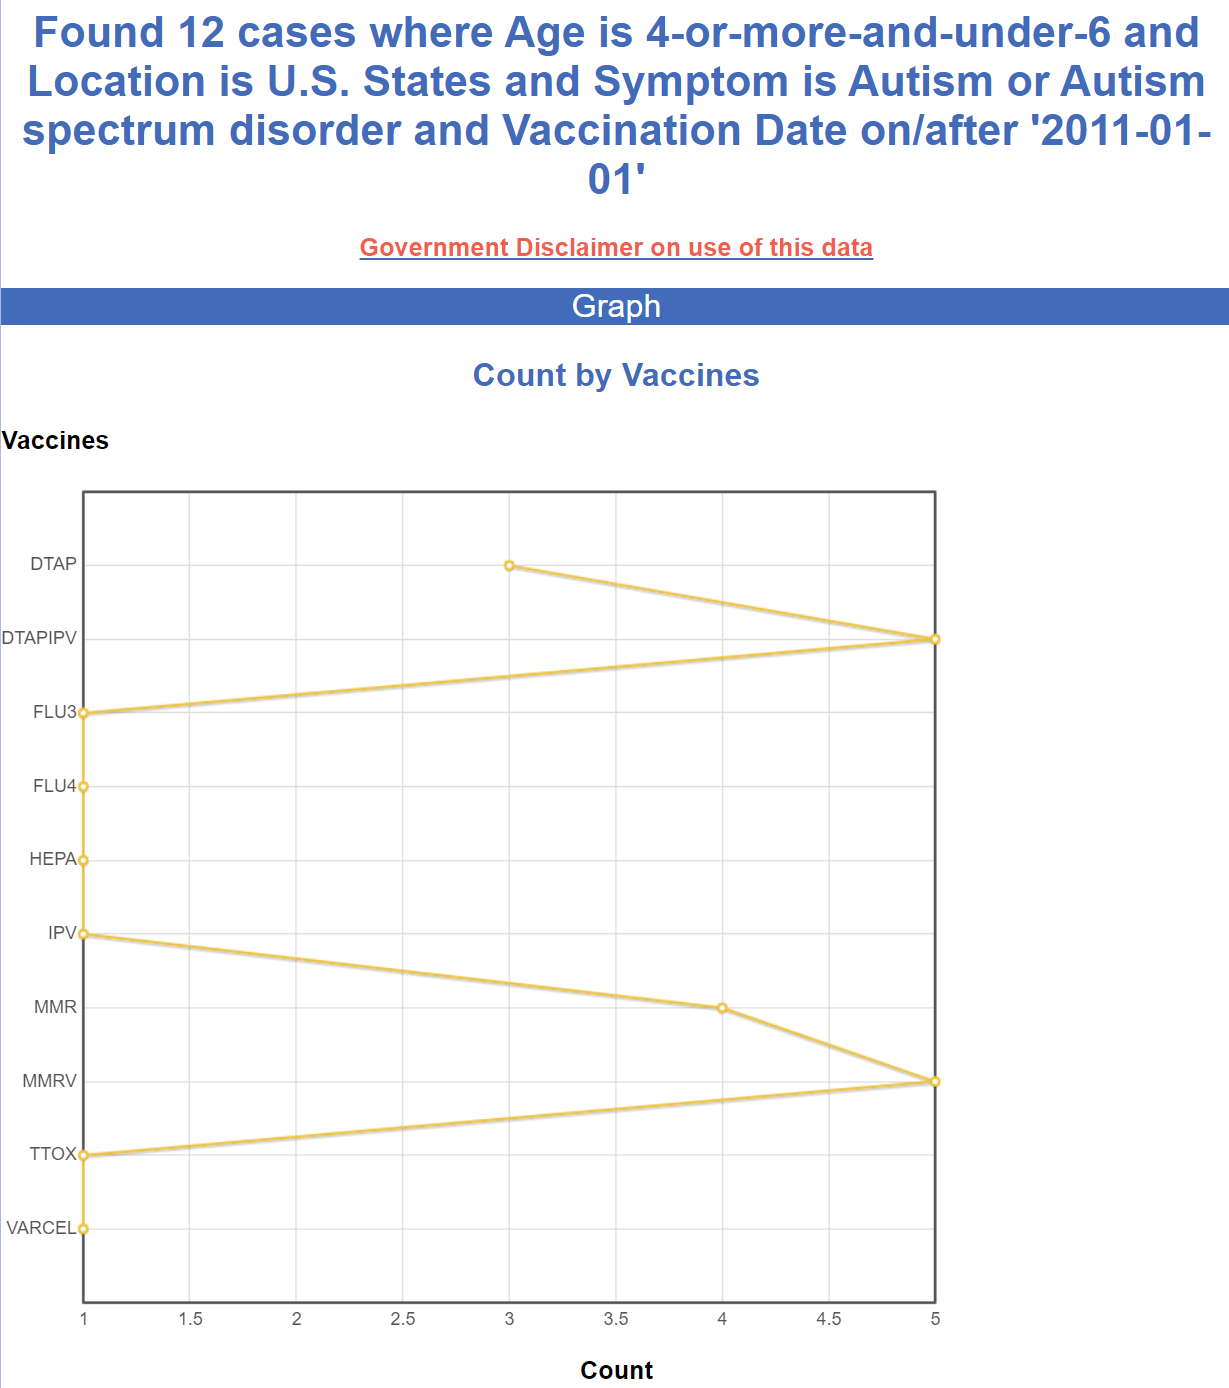
Let’s assume that vaccines don’t cause autism. Then each vaccine should generate the same number of reports. For combo vaccines, we can just allocate the autism reports to all the component vaccines.
Using the chart, we get:
- DTaP: 8
- IPV (Polio): 6
- COVID: 0
- Flu: 2
- MMR: 9
- Varicella: 6
Flu is very low as a cause of autism compared to the MMR.
6 to 30
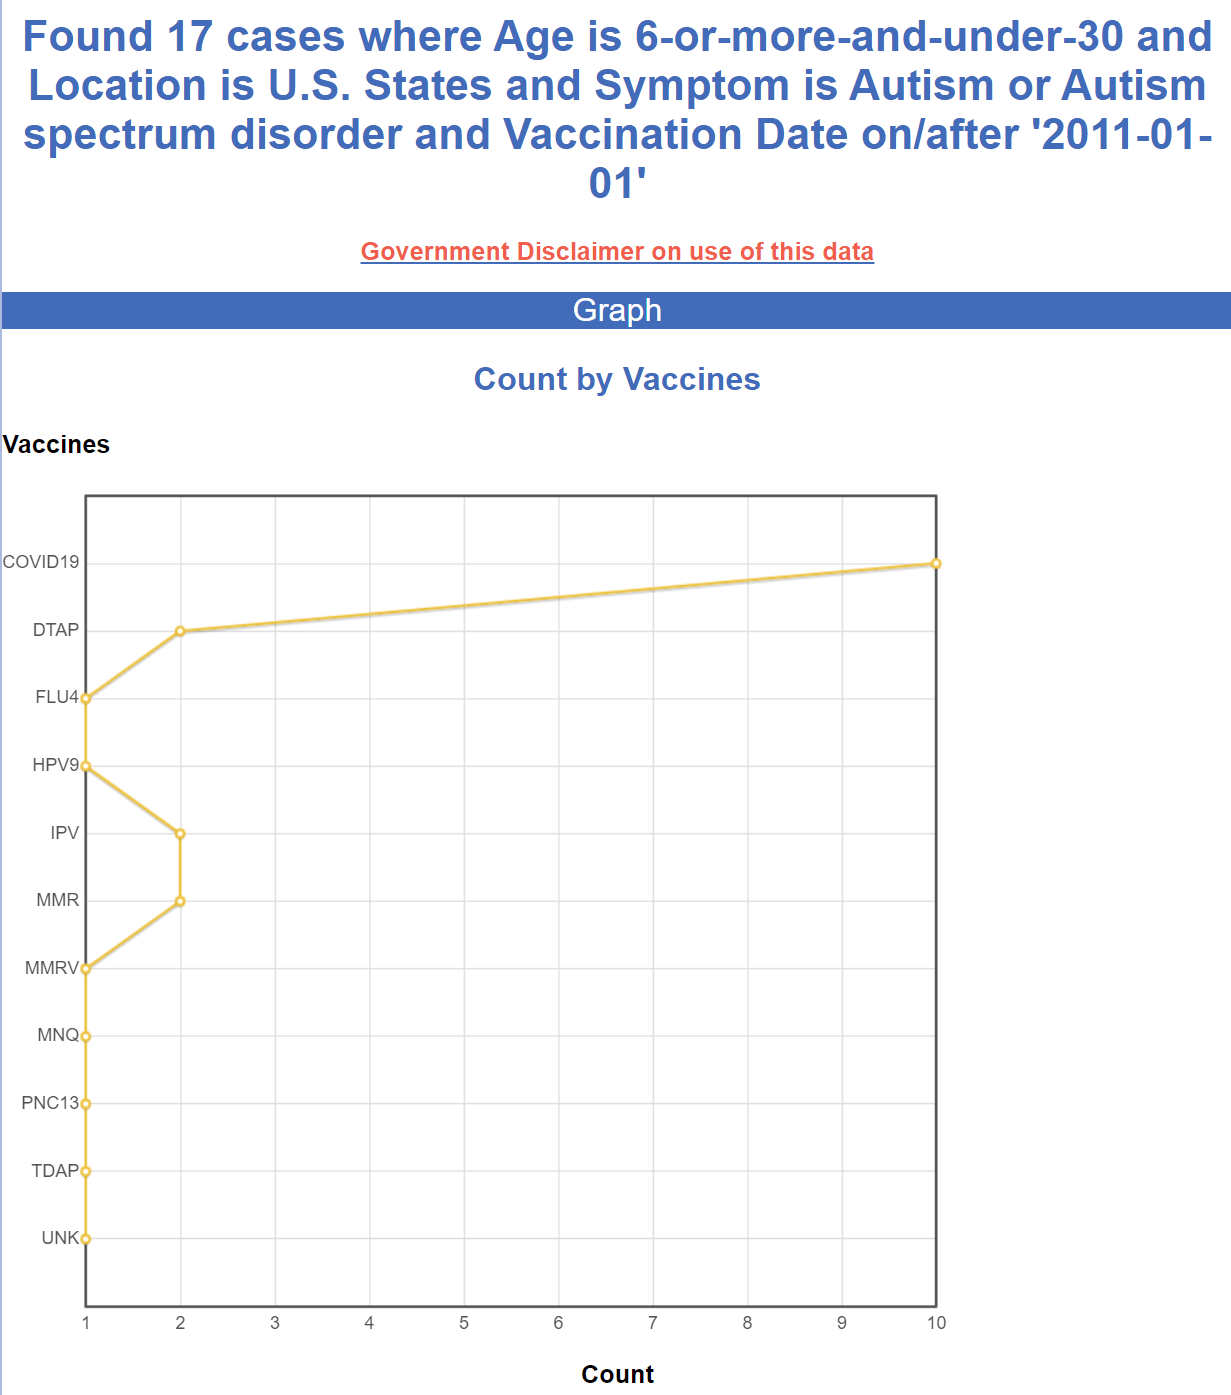
Below is a query for people from age 6 to 30 for the last 12 years combined. As you can see, the COVID vaccine is the clear winner, even though it just got on the market. FLU3 had zero cases. FLU4 had only one case of autism in the 12 year period for this age range.
But surely there are more flu shots administered than COVID shots in this age range for the last 12 years.
So the fact that the COVID shots had 10X more autism rates than the flu vaccine (which had more total shots) shows that autism rates are vaccine dependent. If there is another reason, I’m all ears. It could be “statistical noise” as well but it’s more than a 3 sigma deviation, so that is much less likely. It’s 99.7% likely that it is the vaccine causing this kind of difference.
VAERS query for autism over all ages and all time
Search for “autism or ASD” over all vaccines, all age, all time, all locations. This gives us a relative feel for which “monovalent” vaccines are the most likely to be the most problematic:
- MMR
- Hib
- DTaP
- Hep B
- DTP
- Polio (IPV and OPV)
- PNC (Pneumococcal)
- Varicella
Whereas the influenza vaccines (FLU3 and FLU4) are given much more often yet have way lower rates for autism.
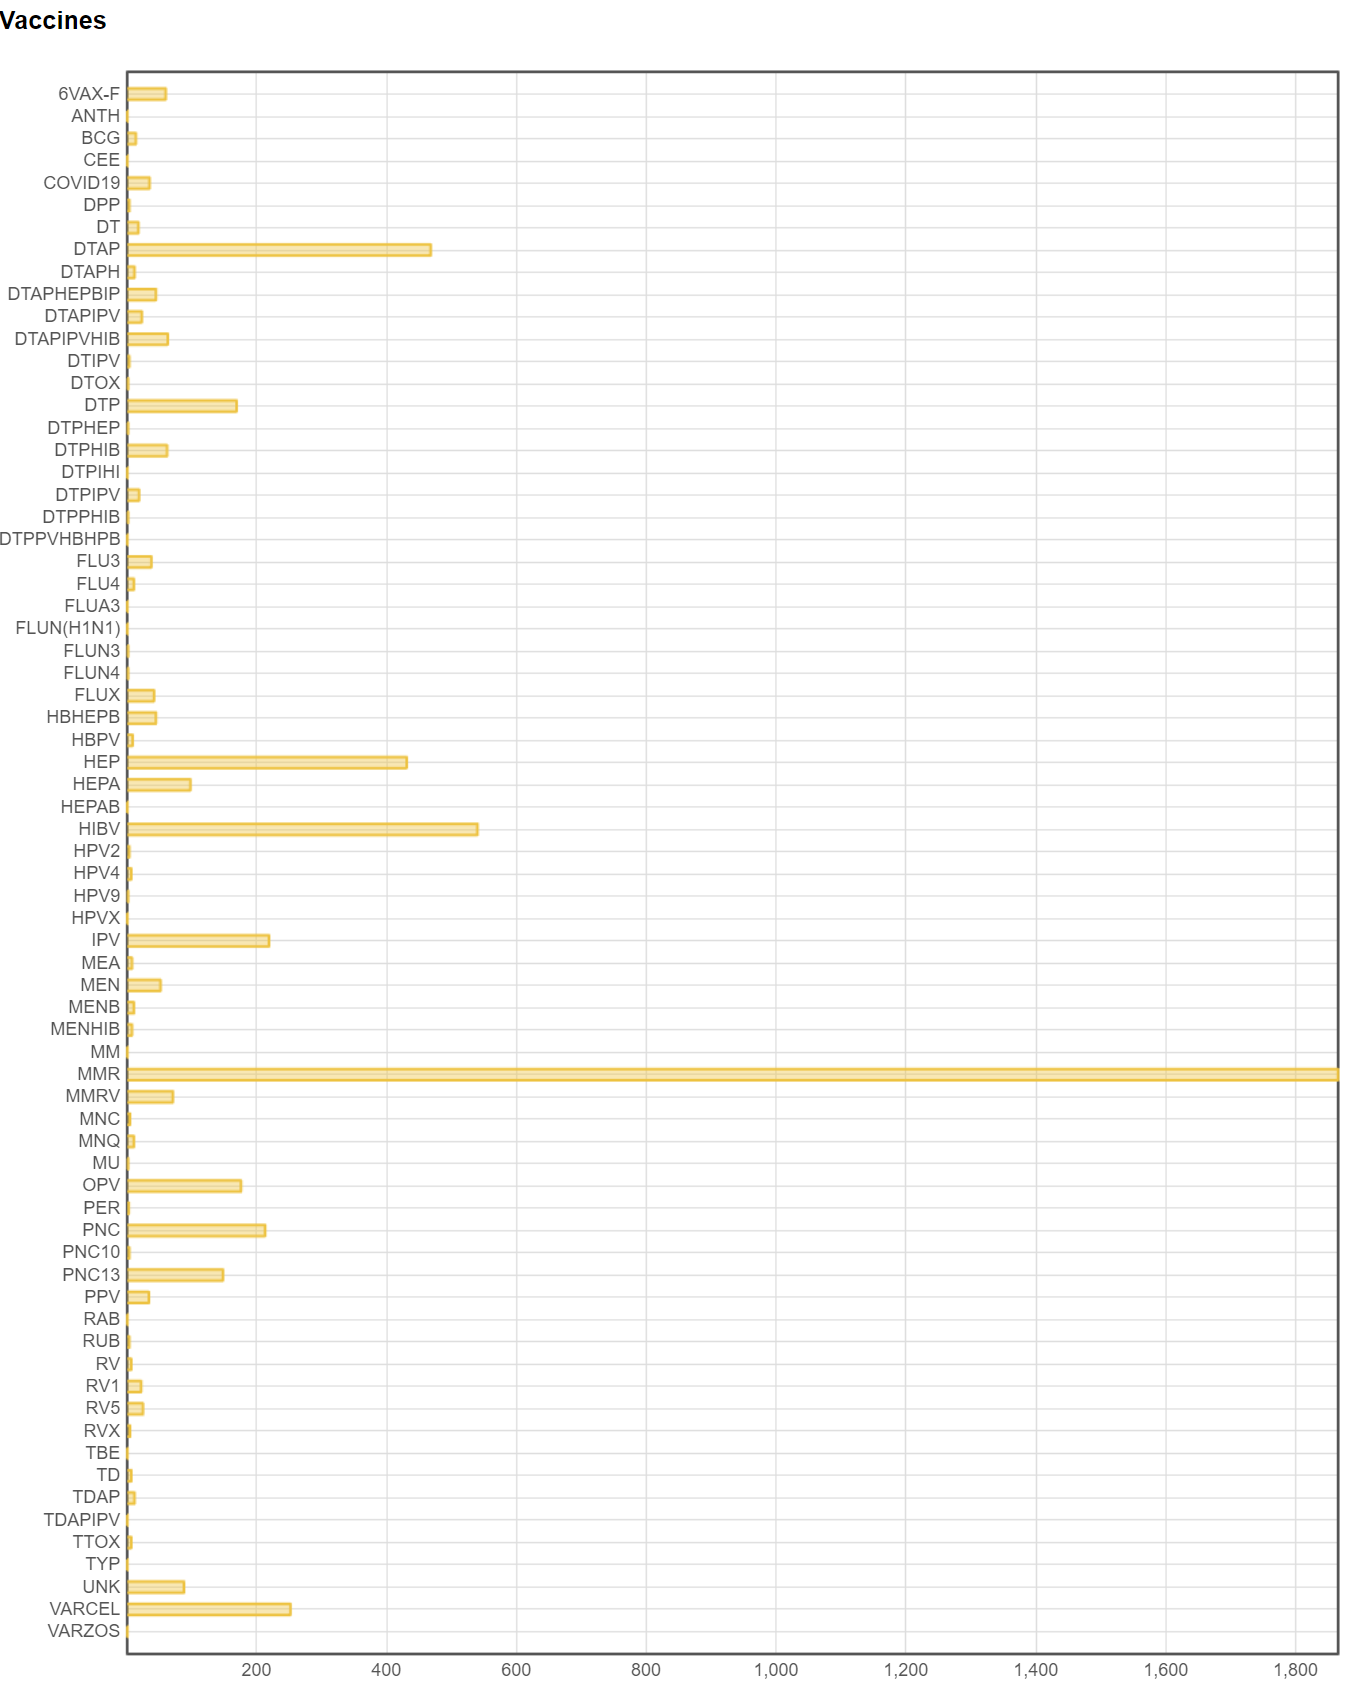
My interpretation of the results
The 1 to 1.5 year data clearly shows a huge disparity in the rate of autism cases between vaccine types.
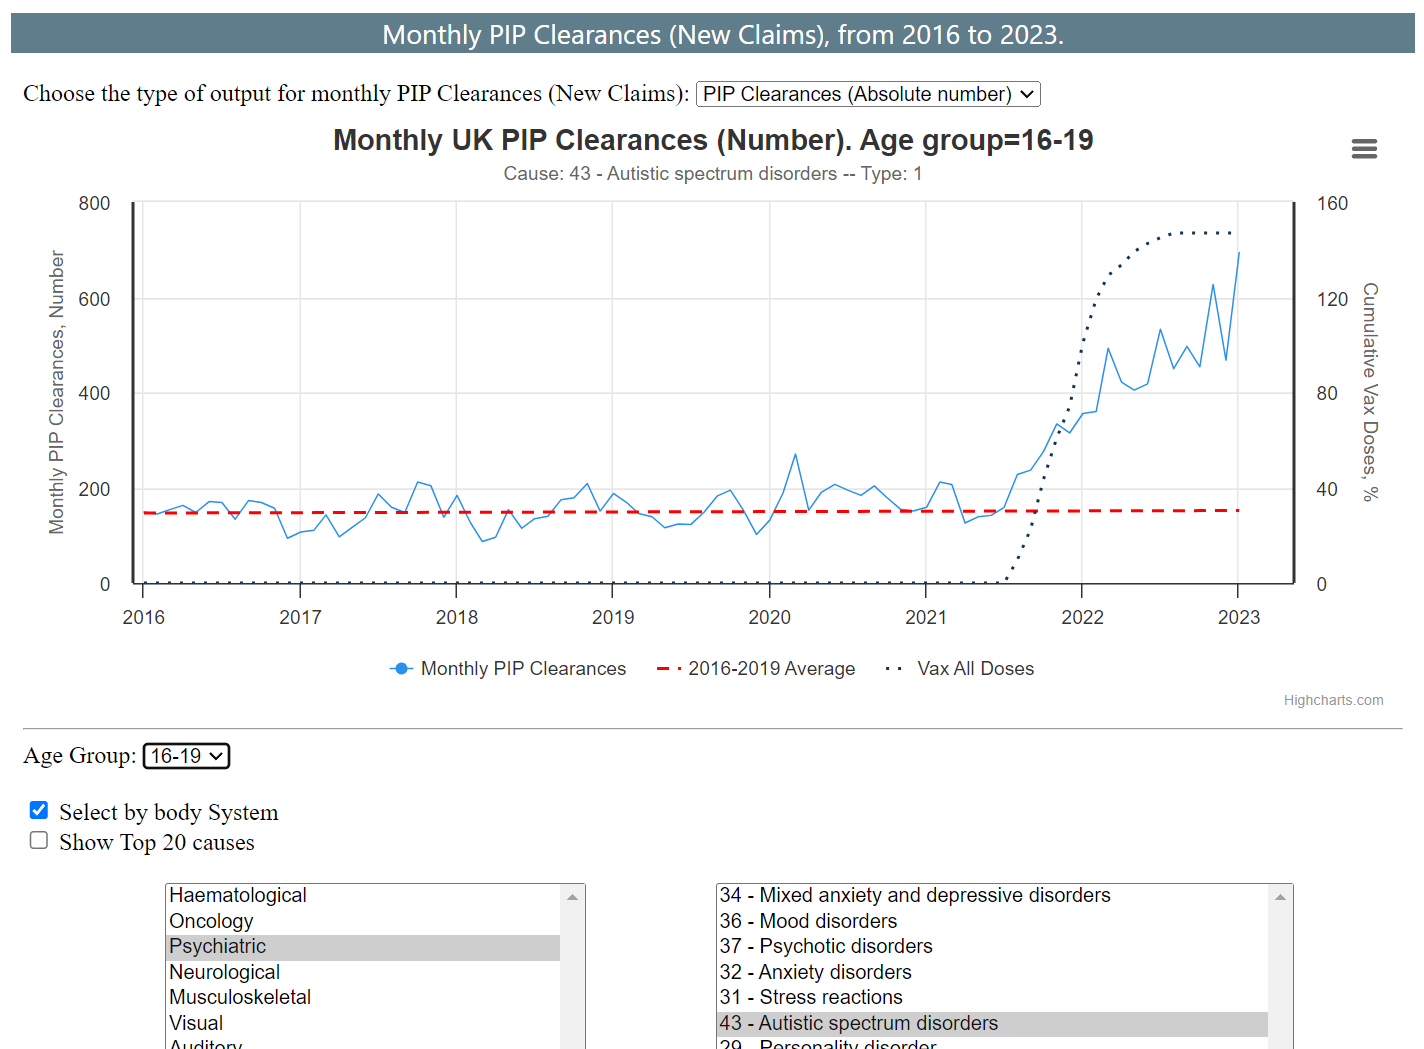
New autism cases in the UK post-COVID vaccine have skyrocketed
How do they explain this sudden rise in the rates of autism claims among an age group with a stable rate of autism:
Here it is by Z-score, showing a Z-score of 15.
So since the COVID vaccines rolled out, a relatively stable rate of autism has increased DRAMATICALLY in the UK. A Z-score of 15 means something caused it.
It coincides with the COVID vaccine rollout in the UK.
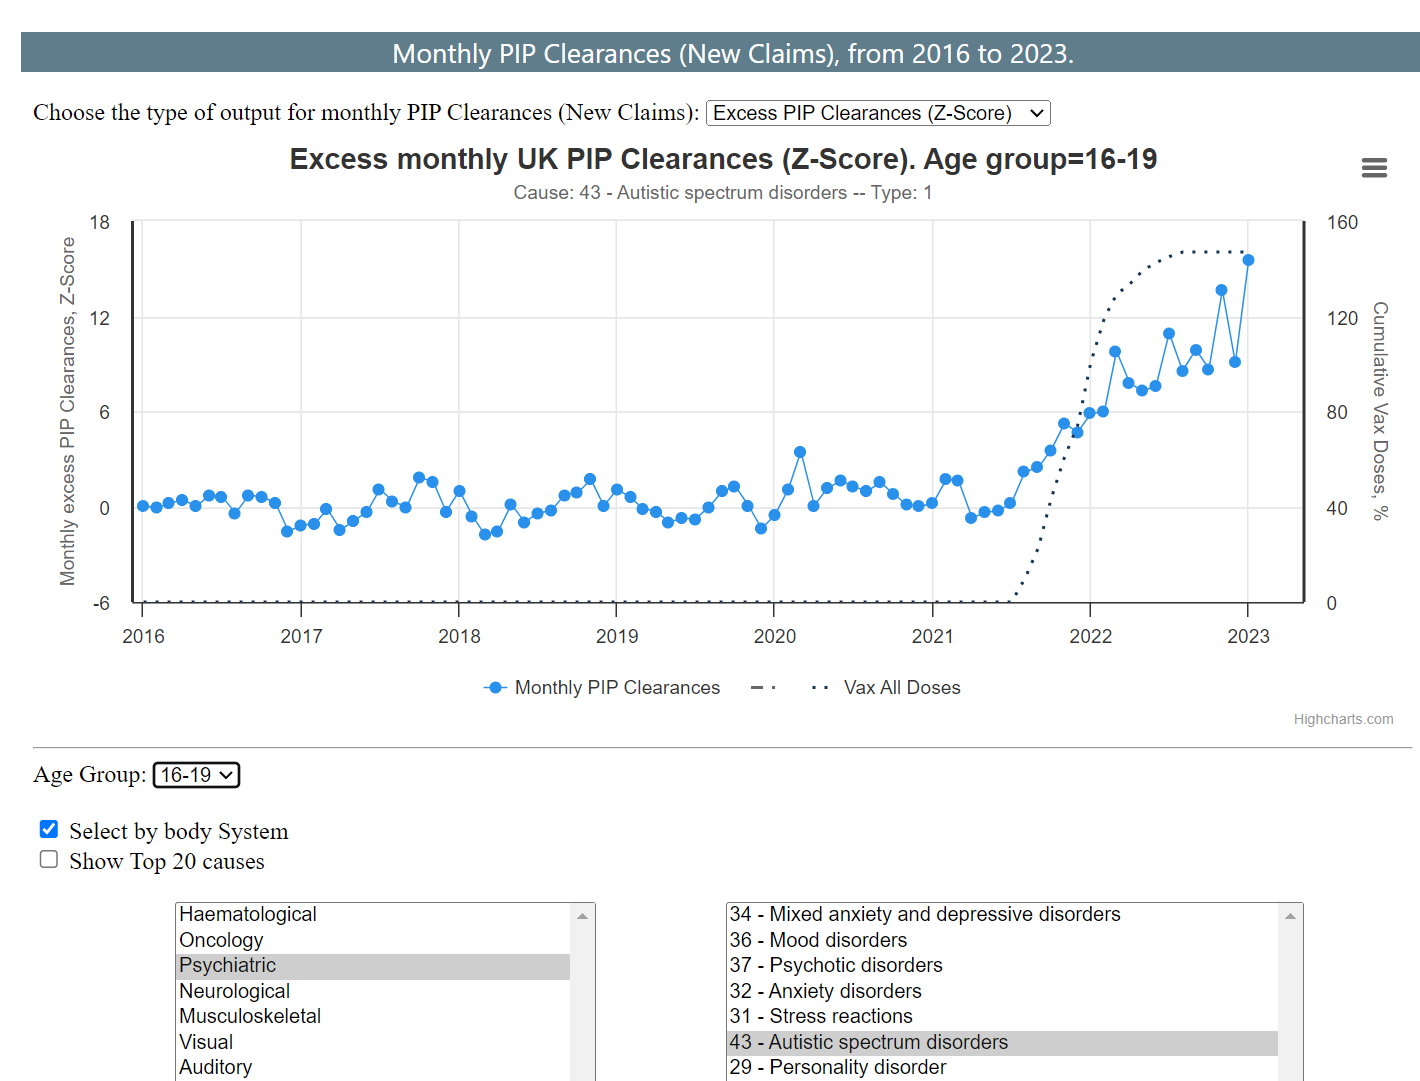
If the COVID vaccine didn’t cause this increase, what did?
Summary
The VAERS data shows that autism event reports vary based on vaccine type. The only way that can happen is if vaccines are causing autism.
The UK data is fully reported. It shows that autism skyrocketed after the COVID vaccine rollout began.
If someone has a better explanation that fits all the data, I’m all ears.
This adds even more evidence to the case that vaccines cause autism.
But nobody seems to care. But maybe one day, some health authority somewhere will be open to looking at the data and stopping the vaccines.


Leave a Reply
You must be logged in to post a comment.